Did your students learn? How do you know? Direct measures answer these questions and offer you descriptive data to help you to think about what learning students achieved and where they still need to build their skills. These data help you to close the loop, that is, work towards improving your students’ learning. Subject matter experts create these tools to find out how well students demonstrated their learning in each of the relevant student learning outcomes.
For detailed instructions on how to measure student learning, see chapter 3 of A Guide to Curriculum Mapping: Creating a Collaborative, Transformative, and Learner-Centered Curriculum (Harrison & Williams 2024), or request a consultation or workshop.
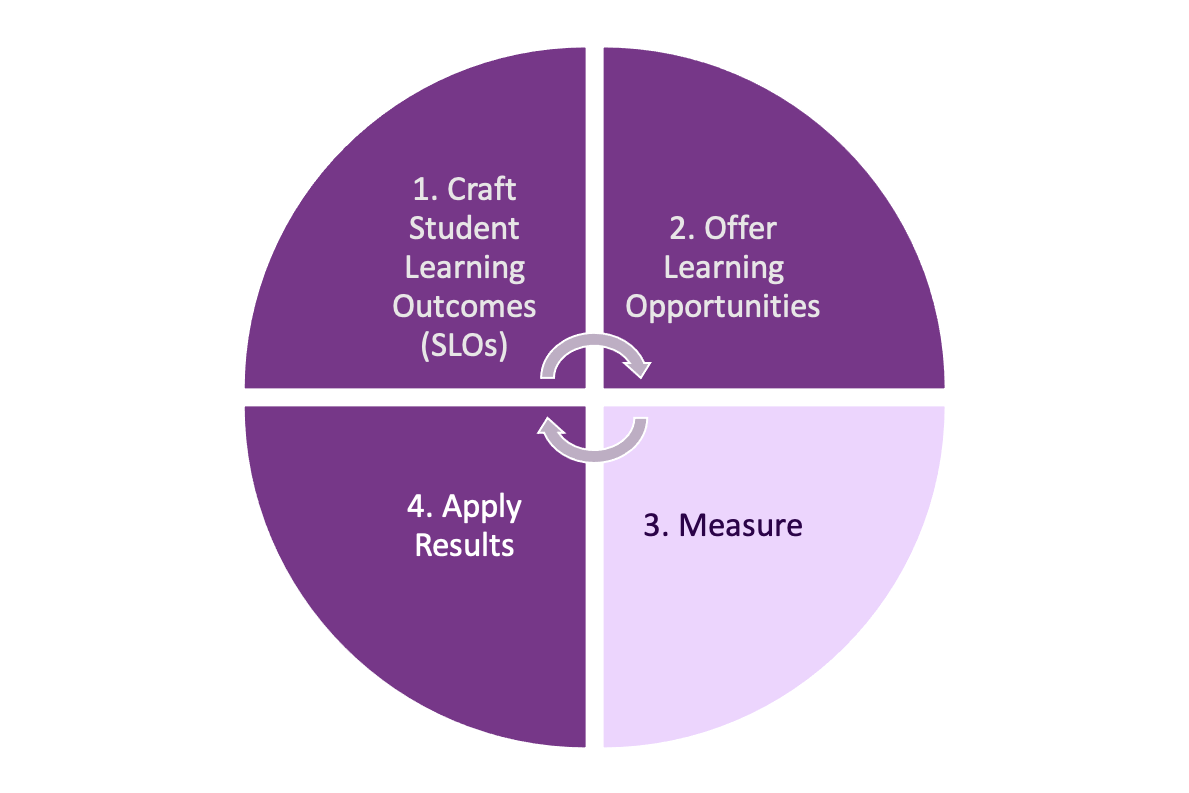
How do you measure learning? How do you know if your students have achieved your “desired results,”* the student learning outcomes you articulated in the first part of the learning assessment loop? You can find out by analyzing your direct measure results.
Direct and Indirect Measures of Student Learning
Direct and indirect measures of student learning help you determine whether or not students have achieved your learning goals and where they still need to build their skills. Analyzing both types of measures together can offer insights about students’ experiences and provide richer context for understanding the direct learning evidence. For further examples of both and direct and indirect measures, please see our Examples of Evidence of Student Learning document.
Direct Measures
Direct measures of student learning are tangible evaluations that require students to demonstrate their actual knowledge and skills through coursework, exams, or performances. They are essential for institutional assessment because they provide objective, irrefutable evidence of student achievement, ensuring academic programs meet desired goals and accreditation standards.
Examples of direct measures include:
- Scores on selected items of a multiple choice and/or essay test, such as final examinations in key courses, mapped to the learning outcomes they are designed to measure;
- Performance on written work related to specific learning goals as evaluated by specific criteria or rubrics;
- Portfolios of student work, scored using a rubric;
- Performance in labs related to specific learning goals as evaluated using specific criteria or rubrics;
- Performance on “capstone” experiences, such as research projects, presentations, theses, dissertations, oral defenses, exhibitions, or performances, related to specific learning goals as evaluated using specific criteria and scored using a rubric;
- Other written work, performances, or presentations, scored using a rubric;
- Scores on standardized national tests or pass rates on certification or licensure exams. It’s especially helpful if the standardized tests have sections that allow you to see where students are achieving specific learning aims and where they are not. Or you can examine specific questions that address learning goals you have for students.
Indirect Measures
Indirect measures of student learning serve to capture students’ perceptions, attitudes, and confidence regarding their educational experiences, rather than testing their explicit skills and abilities. They serve as valuable proxies for learning and are most useful for evaluating instructional effectiveness and providing essential context to the hard data of direct measures.
Examples of indirect measures include:
- exam or course grades;
- student satisfaction surveys;
- retention and graduation rates;
- surveys or focus groups of students’ or alumni perceptions of their own learning;
- surveys of employers;
- placement of graduates into jobs;
- placement of graduates into graduate and professional programs;
- department or program review data;
- student achievements such as honors, awards, and scholarships.
Rubrics & Rubric Maps
A rubric is a tool that measures something subjective and qualitative; it converts that measurement to numbers, so you can compare, aggregate, and analyze the results.
When you add a rubric map to your rubric, you align each criterion to the relevant student learning outcome. After you use the rubric to assess student learning, the resulting data helps you to see if students demonstrated the learning you defined in your student learning outcomes. The alignments can be abbreviated and include course, program and institutional outcomes.
See the Capstone Data Example in the UMBC Curriculum Map Template package to see how rubric data might look.
Tests & Test Maps
A test map aligns test questions to student learning outcomes, so you can see how well students are achieving your “desired results.”* While students are typically interested in their total score, or the grade resulting from the test, you will want more nuanced information about how well each student and the students collectively are demonstrating the learning.
Consider reviewing test results with students, so they can see how the questions align to the student learning outcomes while gaining both personal and contextual views of the results.
*See our backward design page that explains this planning process including formulating “desired results.”
Text and graphics created by Jennifer M. Harrison, Ph.D.